")
By Silvester Boonen, with Jonas Simons, Yannick De Win and Raghav Sharma
In Belgium, we say, “meten is weten”, which translates to measuring is knowing.
That idea quietly guided us on a crisp January morning in the Sonian Forest, where local researchers, forest managers, and practitioners gathered for a training event organised within the context of the INFORMA project. The goal? To explore how new tools can help us to measure carbon stocks and biodiversity potential more accurately and efficiently, and perhaps more importantly, how these measurements can inform forest management decisions.
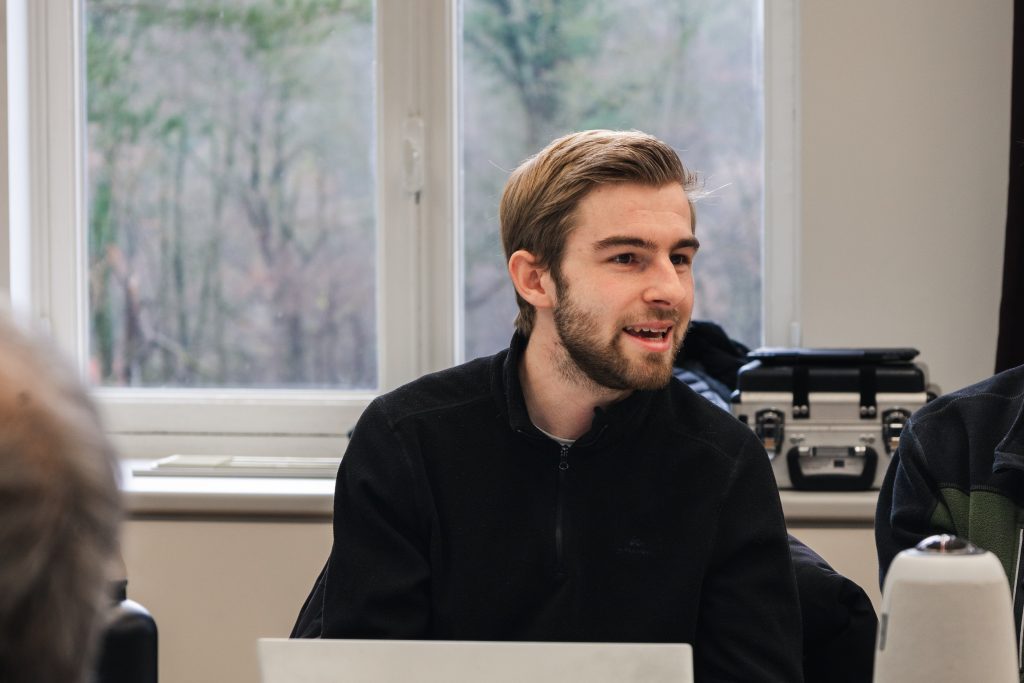
Photo: Raghav Sharma
At 10:00 sharp, Kris Vandekerkhove (INBO) officially welcomed the participants, and I (Silvester Boonen, EFI) followed with a short introduction. Today, it was important to have a practice perspective on research results. INFORMA contains many packages of various research, but today Jonas came to talk about his work in WP2, which is on the comparison between managed and unmanaged forests. Many ecosystem services can be affected by forest management, the main focus for this day was on carbon storage and the Index for Biodiversity Potential. Jonas Simons (KULeuven) opened with a feedback loop which would help him to improve further analyses, help him to frame his results so they can be more useful for practice, and who knows, maybe spark further research ideas!
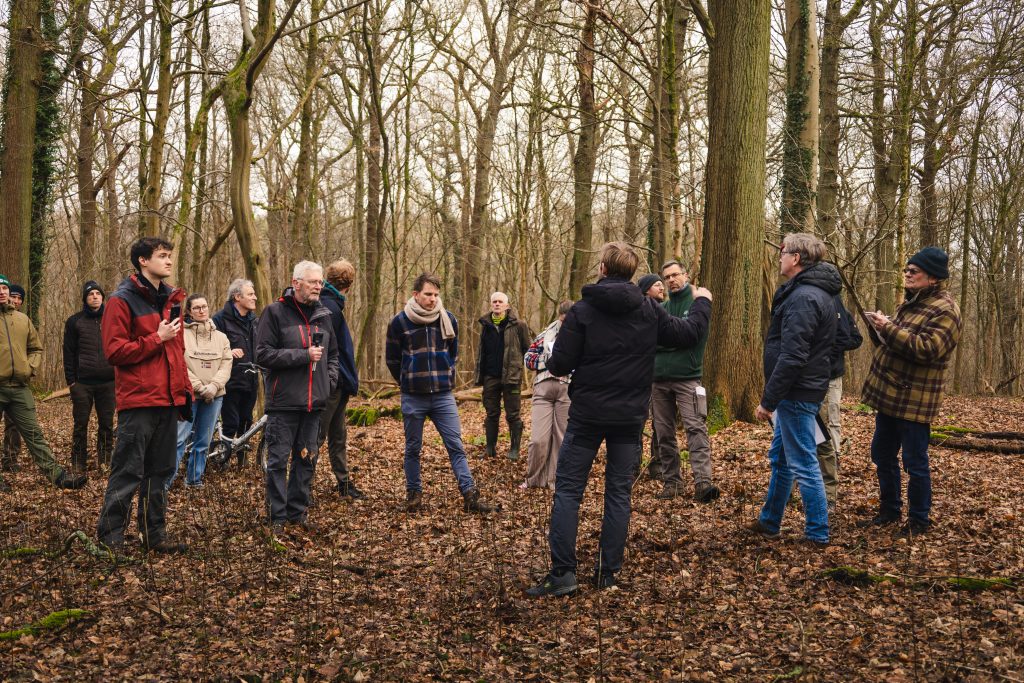
Kicking off with managed and unmanaged forests, Jonas throws out the philosophical question to the audience: Why do we manage our forests? Referring to wood extraction, biodiversity, climate change mitigation, avoiding disturbances, and recreation. If we want to optimise the delivery of one of these services, is management or non-management preferred? Based on a show of hands, there are mixed feelings in the room, but these votes already highlight the answer: it is, of course, “context-specific” (e.g., dependent on-site conditions), as Jonas implies.
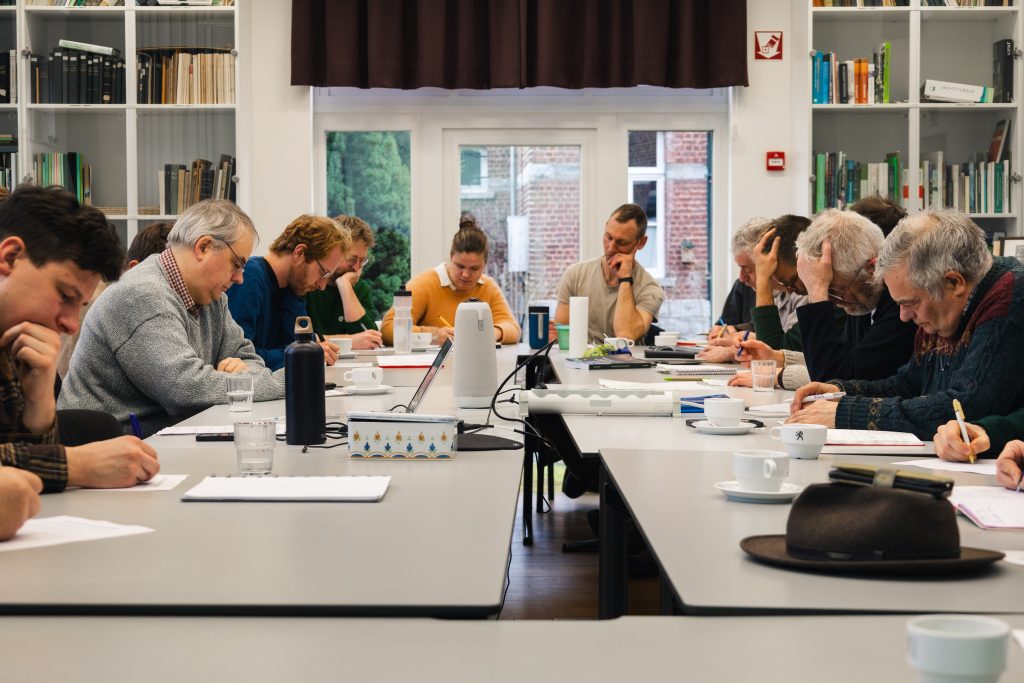
Photo: Raghav Sharma
So, thinking of the five services or functions, should we manage or not? Let’s see what science tells us! Well, for timber, an obvious starter, no management means no timber is extracted, and tree growth is not promoted. Regarding biodiversity, it is not surprising that unmanaged would serve better for biodiversity; however, this effect is taxon-dependent (Paillet et al., 2010), as Jonas tells us. But what about climate change mitigation, what about the carbon? Well, individual research does not provide sufficiently strong and comprehensive evidence to draw general conclusions. Therefore, Jonas and colleagues started a systematic review and a field campaign to delve deeper into this issue for INFORMA. Their field campaign consisted of installing the INFORMA Forest Management Platform to compare managed and unmanaged patches. These patches are linked in clusters (see this blog if you want to know more), so the effects of the site conditions will be reduced, and only the effects of management differences will be more apparent. Not only carbon but also the index for biodiversity potential was compared during the field campaign. This index is a diagnostic tool designed to help forest managers practice biodiversity-friendly forest management. Developed by Larrieu, Gonin and colleagues, this indicator is based on a rapid assessment of ten factors (e.g., standing deadwood) that influence the capacity of forest stands to support diverse communities. Each factor has a capped maximum score of 5, meaning that the maximum score for all ten factors would be 50. As this is originally a French index, it has been adapted and translated to the Benelux. A capped and an uncapped were applied, which we will learn about later. As the round of feedback was provided, it was time to get into the field! There, we would visit these patches and learn more, and most importantly, see the results of the research with our own eyes.
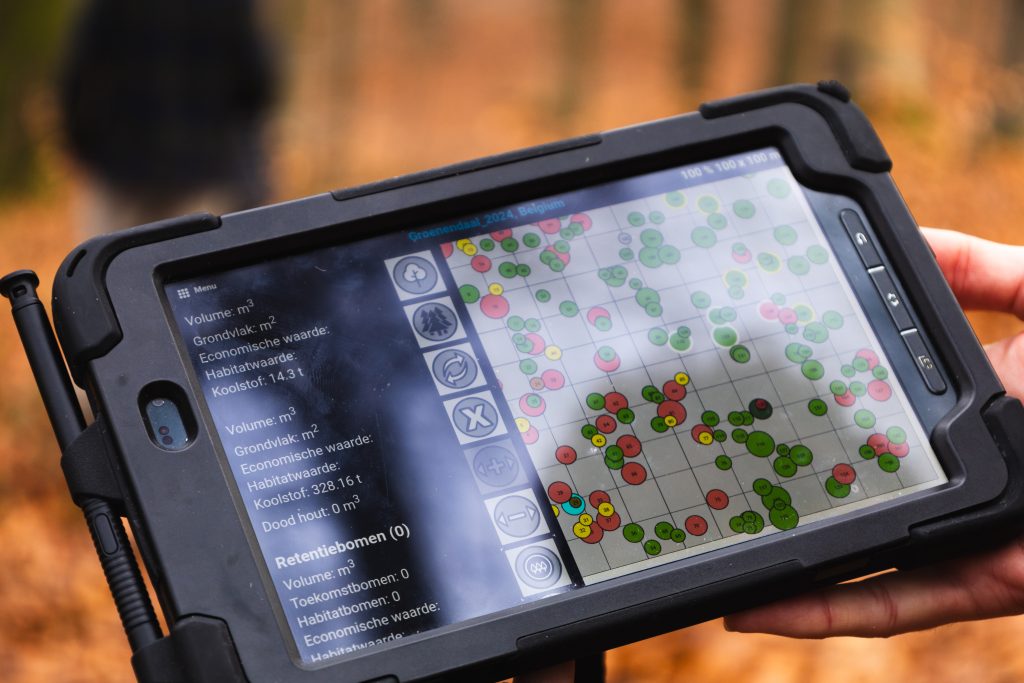
We walked to the Groenendaal marteloscope, i.e., a plot to perform (virtual) tree selection exercises as a tool for in-field training. I introduced them to the site, the stand’s Index for Biodiversity Potential score, the I+ software, and the task ahead: optimise timber production while maintaining ecological function.
Participants worked in small groups, each group responsible for one of the four quadrants of the marteloscope. The rules were clear: Harvest a maximum of 20 m³ per quadrant (i.e., one subplot of the marteloscope, 0.25 ha) and select at least 2-4 habitat trees. Stem volumes were hidden in the software as participants had to estimate them themselves.
As the participants started their virtual hammering, discussions quickly intensified.
“Is this one better as a habitat tree?” …. “If we remove this competitor, that will promote our future crop tree”. When everyone gathered back, the results were striking. Almost all groups had independently converged on harvest volumes close to the maximum, and that was pure on stem volume estimation! More importantly, each group had defined their management objective, highlighting a key lesson of the day: good management starts with clear objectives. Further in the discussion, one group looked beyond the canopy, noticing an exceptional mast year for oak and a lack of regeneration. They argued for opening the canopy to let light reach the forest floor. But oak needs large gaps. Would that mean exceeding the 20 m³ limit? Deadwood sparked another debate. Lying deadwood was already abundant (Index for Biodiversity Potential score: 5), but standing deadwood was completely absent (score: 0)1. Several groups decided to create standing deadwood, at least virtually, by girdling selected trees.
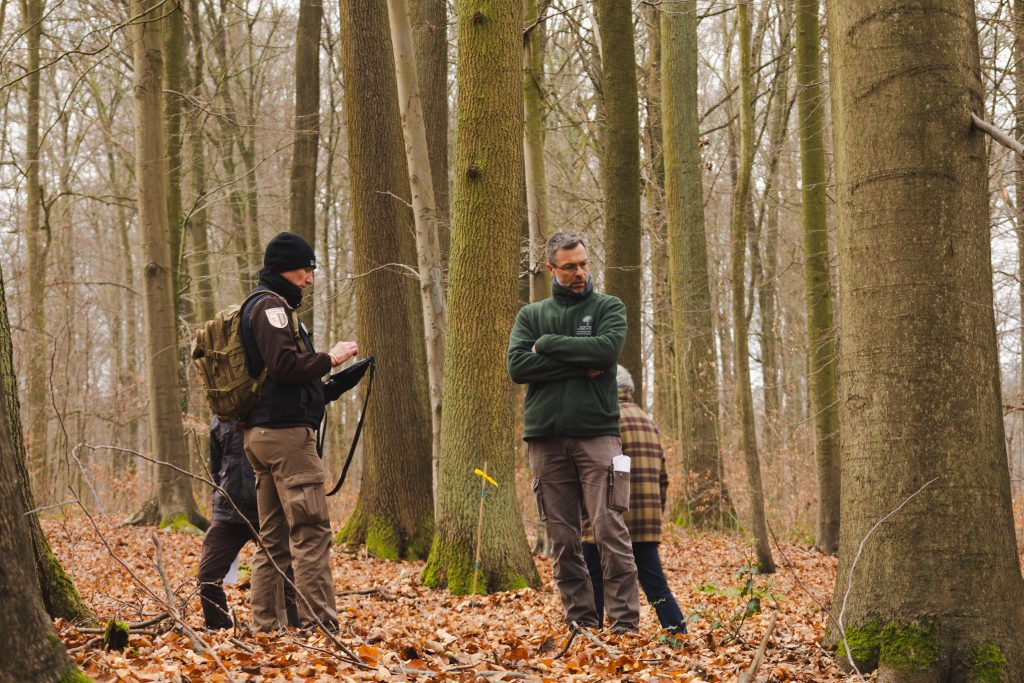
Photo: Raghav Sharma
Measuring is knowing: carbon and biodiversity in the field
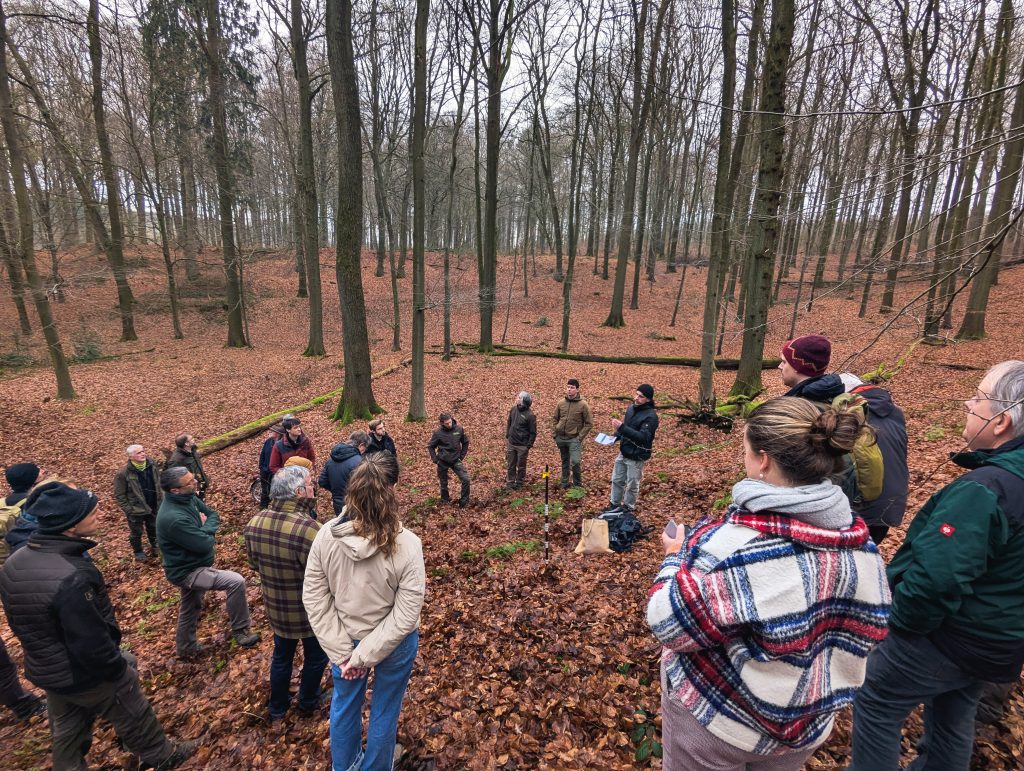
After lunch, we set off on an excursion through some of the INFORMA Forest Management Platform patches, guided by Jonas, Kris, and Yannick De Win (INBO). This time, the participants didn’t estimate; they observed results.
In the forest, Jonas presented the findings on carbon stocks. The message was clear: the aboveground carbon stocks are higher in unmanaged forests, the difference increases with time since cessation of management, and such differences can reach 50–60 tonnes of carbon per hectare. Soil carbon, however, responds more slowly. Detecting clear trends takes time. One surprising result emerged too, carbon in the pool of standing deadwood had the tendency to be higher in the managed stands, reminding us that forest dynamics are rarely straightforward.
Along the way, Jonas introduced the Arboreal App, which is a mobile tool using augmented reality and LiDAR to measure tree diameter, height, and even set up inventory plots (see this blog for more information and research results). Comparisons with classical field measurements showed remarkably good results, especially for diameter at breast height. One forester pulled out a measuring tape to double-check. Measuring is knowing, after all!
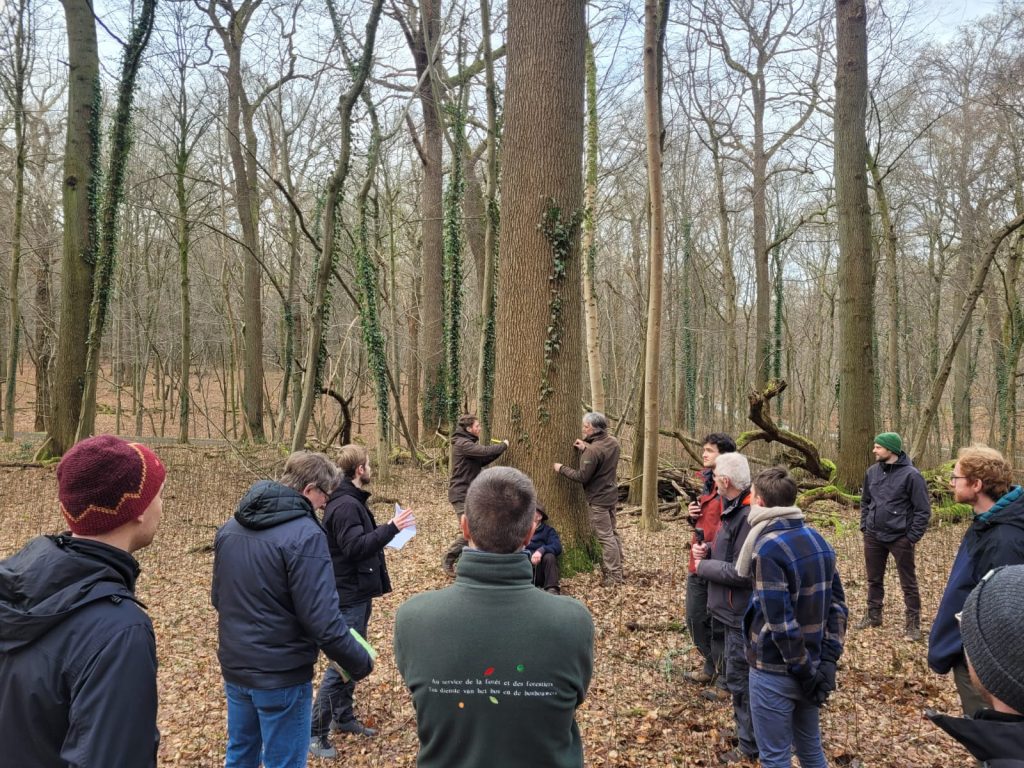
Photo: Silvester Boonen
Exceeding the scale
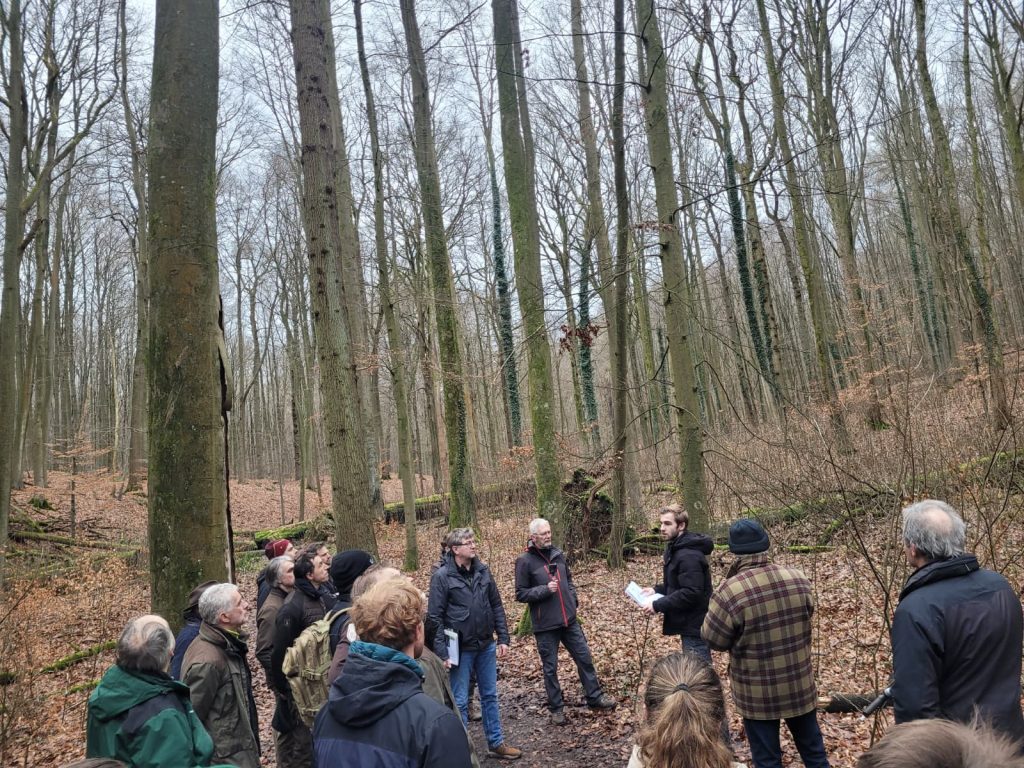
Our final stop took us into one of the most special parts of the Sonian Forest: the UNESCO World Heritage beech forests, including the Zwaenepoel reserve. These forests are part of a network spanning 18 European countries. Here, the Index for Biodiversity Potential told an interesting story. In such old forests in both managed and unmanaged stands, capped score for factors such as standing and lying dead wood and very large trees is often exceeded. When using the uncapped version, differences become clearer; unmanaged forests consistently show a higher hosting capacity.
The takeaway?
The Index for Biodiversity Potential is highly suitable for managed forests, but forest reserves and old-growth forests in those exceptionally productive forests require adjusted scoring systems to fully capture their ecological value. As the light faded, we returned to the regional office for, as tradition goes, informal drinks and final conversations. The day had brought together theory and practice, data and experience.
Special thanks to Agentschap Natuur & Bos, the state forest enterprise and administration for hosting us!
Article adopted from the INFORM project, keep an eye on our INFORMA website as results will be wrapped by summer!
- Curious to learn more in detail about how the Index for Biodiversity Potential and its score function? Consult the educational documents on: https://www.cnpf.fr/ibp-index-biodiversity-potential ↩︎